Geographic Information Systems (GIS) can capture, manage, and analyse many types of spatial data in a variety of ways. Our expertise in GIS means we can apply a range of Map Visualisation & Analysis techniques to support or enhance the work conducted by your organisation or community.
Map visualisation & analysis can be used in a host of areas, such as environmental management, business effectiveness, or public sector intervention planning. We have experience working across sectors, and can shape visualisation and analysis to meet your needs.
Local Authorities and Government
Map visualisation & analysis can help you to identify key areas for action planning across a broad range of topics, such as housing, education and health. With the insight of GIS, you can direct action to transform the local area.
View our Information Sheet for further information.
Community and Voluntary Groups
If you are a community or voluntary group, map visualisation & analysis can help you identify trends in activities or actions relevant to your work, or to visualise the influence your work has had on the surrounding area.
View our Information Sheet for further information.
-

D-NOSES is a three-year EU funded research project which aims to provide a solution to the largely neglected issue of odour pollution, changing the traditional top-down approach for a bottom-up one. The lack of regulation from authorities around odour pollution is mainly due to it being difficult to reliably measure and the potential solutions being costly to implement.
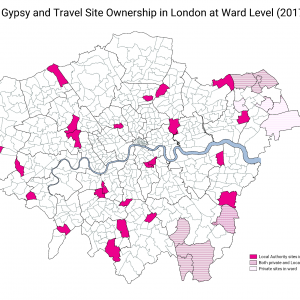
There are around 30,000 Gypsies and Travellers in London. Their culture and traditions have developed through a nomadic way of life over centuries. However, across the country the community face an uncertain future. With some of the poorest social outcomes of any group in Britain the burgeoning cuts to public services will have a disproportionate effect on the community.

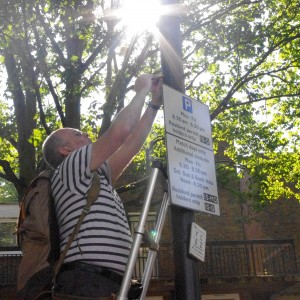
Science in the City is a project that is being carried out with residents in the Barbican and Mansell Street, in the City of London. Residents are using low-tech tools to measure Nitrogen Dioxide and particulates.
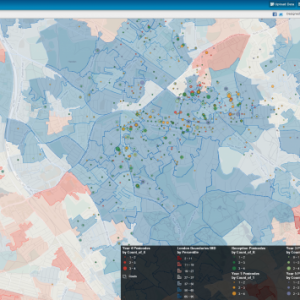
In 2009, Mapping for Change supported communities across London to measure and map local air quality. Use of a ‘citizen science’ approach meant local residents in seven locations were able to collect data, then see the real results of their monitoring activities, and subsequently embark on a campaign to see the serious results addressed.
A group of parents from East Finchley were frustrated with the lack of good community secondary schools in their area and decided to unite and demand for a change. The group, Local Schools for Local Children, expanded, and has now more than 1,000 supportive local parents, who are campaigning for a new Free School – The Archer Academy.


